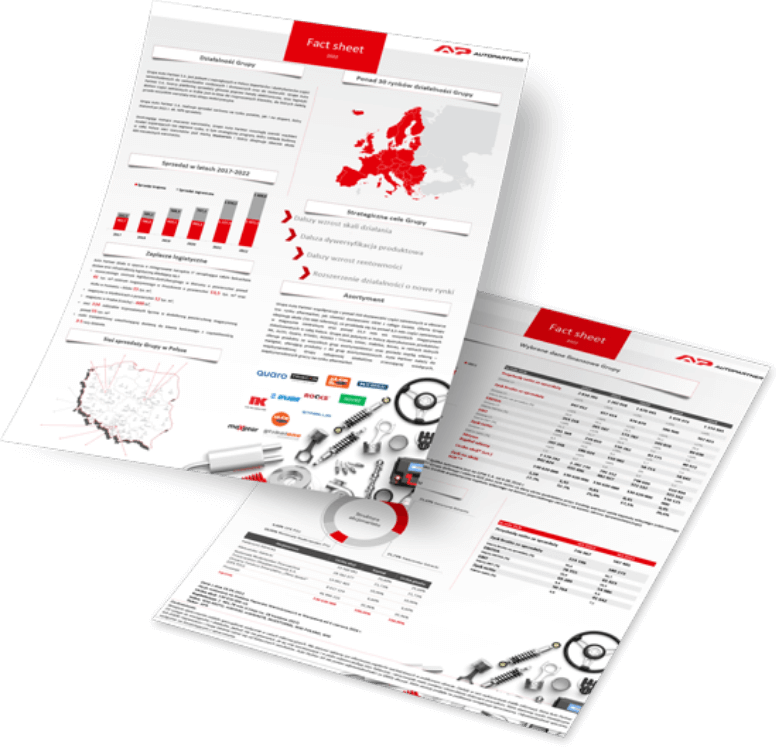

| in thousand PLN | 2024 | 2023 | 2022 | 2021 | 2020 | 2019 | 2018 | 2017 | 2016 | 2015 |
|---|---|---|---|---|---|---|---|---|---|---|
| Gross profit on sales (%) | 4 112 497 | 3 653 384 | 2 834 701 | 2 262 018 | 1 670 441 | 1 479 373 | 1 154 993 | 914 858 | 705 385 | 518 638 |
| Change y/y | 13% | 29% | 25% | 35% | 13% | 28% | 26% | 30% | 36% | 22% |
| Gross margin on sales | 1 127 221 | 989 879 | 847 012 | 657 614 | 476 879 | 386 900 | 307 023 | 241 686 | 181 311 | 130 897 |
| Change y/y | 14% | 17% | 29% | 38% | 23% | 26% | 27% | 33% | 39% | 17% |
| EBITDA margin (%) | 27,4 | 27.1 | 29.9 | 29.1 | 28.5 | 26.2 | 26.6 | 26.4 | 25.7 | 25.2 |
| EBITDA | 343 556 | 346 228 | 314 218 | 265 187 | 173 787 | 103 859 | 89 638 | 61 975 | 49 005 | 30 115 |
| Change y/y | -1% | 10% | 18% | 53% | 67% | 16% | 45% | 26% | 63% | -9% |
| EBITDA margin (%) | 8,4 | 9.5 | 11.1 | 11.7 | 10.4 | 7 | 7.8 | 6.8 | 6.9 | 5.8 |
| EBIT | 289 272 | 302 724 | 281 369 | 239 010 | 150 282 | 83 775 | 80 972 | 55 269 | 44 104 | 26 194 |
| Change y/y | -4% | 8% | 18% | 59% | 79% | 3% | 47% | 25% | 68% | 8% |
| EBIT margin (%) | 7 | 8.3 | 9.9 | 10.6 | 9 | 5.7 | 7 | 6 | 6.3 | 5.1 |
| Net profit | 207 976 | 223 586 | 207 268 | 186 024 | 110 982 | 58 714 | 58 642 | 34 884 | 34 489 | 16 338 |
| Change y/y | -7% | 8% | 11% | 68% | 89% | 0% | 68% | 1% | 111% | 8% |
| Net margin (%) | 5,1 | 6.1 | 7.3 | 8.2 | 6.6 | 4.0 | 5.1 | 3.8 | 4.9 | 3.2 |
| Assets | 2 025 927 | 1 793 923 | 1 570 282 | 1 202 770 | 789 953 | 731 526 | 610 999 | 505 598 | 342 149 | 232 365 |
| Equity | 1 234 293 | 1 046 192 | 842 824 | 655 496 | 482 927 | 372 197 | 315 162 | 254 620 | 160 708 | 76 067 |
| Number of shares* | 130 620 000 | 130 620 000 | 130 620 000 | 130 620 000 | 130 620 000 | 130 620 000 | 130 125 000 | 129 450 000 | 117 000 000 | - |
| Earnings per share | 1,59 | 1.71 | 1.59 | 1.42 | 0.85 | 0.45 | 0.45 | 0.27 | 0.29 | - |
| ROE** | 18,2% | 23.7% | 27.7% | 32.7% | 26.0% | 17.1% | 20.60% | 16.80% | 29.10% | 24.20% |
* The company has been listed on the Warsaw Stock Exchange since June 6th 2016.
** The Group defines and calculates ROE as net profit for a given period divided by an average equity balance (calculated as an arithmetic mean of equity as at the end of the previous period and as at the end of the reporting period).
